Infographics
A delightful moment of surprise with a third dimension
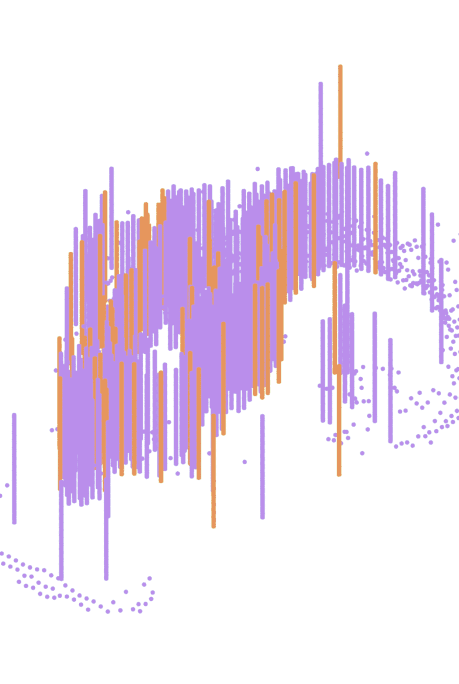
Further playing on the reveal concept, our unique infographics contain two layers of data: Initially presented as a simple dot matrix, users will find that it actually contains more data as the bar-chart is revealed on interaction.
In principle
The screenshots below how we can initially plot a dataset as a dotmatrix, utilizing a wide array of colors for different types on incidents, where another set of values determine the cylinders height on the z-axis.
See live demo of the principle here.